How Many Different Shades Of Gray Are Your Users? Cohort Analysis Will Tell It Like It Is.

Cohort analysis – this is a very effective tool for product and marketing analytics. Unfortunately, few people know about it, and even those who has an idea of this tool, use it very rarely. Nevertheless, the situation soon may change since Google has added basic cohort analysis report to its popular services.
The very core of the cohort analysis
In any given day, the audience of your product is a mixture of those who started using your service today, yesterday, last month, and so on. To follow this inhomogeneous mass and to try to draw conclusions is a very thankless job. The idea of cohort analysis is to divide the customers into groups with the accordance to certain characteristics, and to monitor the behavior of these groups through time.
Usually, user groups (cohorts) are segregated on the basis of weeks (months), when people started using the application. Having selected such user groups (cohorts), you follow them through time and measure key metrics for each cohort. Thus, comparing the data of the March and May cohorts of users, you can objectively compare versions of the product corresponding to these time periods.
For more profound analytics selected cohorts must be further segmented on the basis of the traffic source, platform, country and other factors that make sense for your particular product.
It is highly possible that, the value of your key metrics will be different for different segments, as well as various product changes will have a different impact on different segments of users.
Cohort analysis in Google Analytics
Cohort analysis report can be found in audience section of Google analytics. Its new tool makes the basic cohort analysis report accessible to a greater number of users.
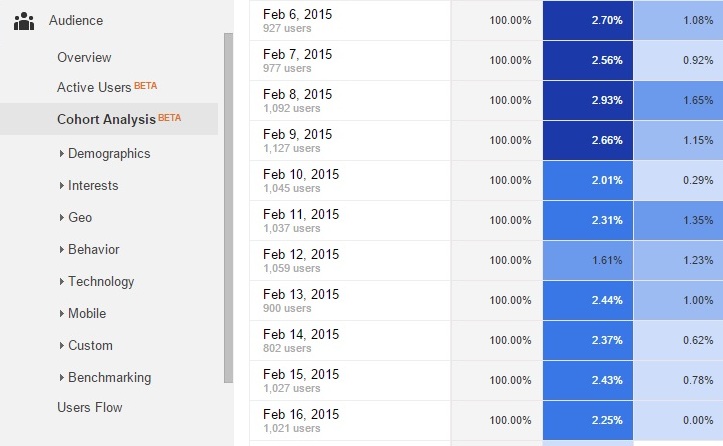
Using Google Analytics, you can get a cohort report on the different types of cohorts, their size, metrics and time:
- Cohort type. It gives you an opportunity to see how the behavior of the users who visited the site on some particular date has been changing through time.
- Cohort size. This attribute can be traced for a day, week or month. It is highly possible that Google Analytics will add additional types of cohorts and will expand the list of available sizes cohorts.
- Metric. It’s just some characteristics that can be measured. Now metrics include the conversion ratio to the number of users, the number of pages viewed by the user, the number of user sessions, and the number of withholding users, the number of completed transactions, conversion, and so on.
- Time range. This is a relative time span at the time of review.
Cohort analysis can be configured.
You can make a segmented cohort analysis. For example, you can see the average length of sessions for visitors who used the mobile devices in comparison to the desktops visitors. Such analysis shows that website visitors who have come to him with desktop computers, usually carried out on it longer than those who went from mobile devices.
How to use cohort analysis.
Cohort analysis can help you make more considered decisions concerning your business. But if you want to get from this new tool of Google Analytics as much useful information as it is possible, do not be lazy and take a little time to prepare.
Firstly, you should remember that cohort analysis (like any other) must start with the question:
- Why are sales going up or down?
- What month period is the most suitable for running the new ad?
- What are the long term goals of buyers who come to the site from a blog?
This will help you decide what you will measure a cohort analysis. After that you need to determine the characteristics or the events of your cohort.
Once you determined which cohort (user group) is the most problem to your business, spend some time on testing a behavior of this specific group of users. In this regard the usability testing will be useful and will help you to find and fix all the weaknesses.
Once you tested your product for usability issues, make sure to repeat the cohort analysis. You will see that your problem user group’s behavior is not a problem for you anymore.
Cohort analysis if it is done in a proper way will help you to clarify the direction of business development.